Blog Post – Seeing in Full Color – Selecting the Right Reagents and Instrumentation for Your Flow Cytometry Assay

Created: September 22, 2025

Christopher Rota, PhD
Scientist, Flow Cytometry

Welcome to this month’s installment of the Flow Matters blog! Generating good flow data starts with picking the right mixture of fluorescent labels to use in your flow cytometry assay (commonly referred to as a “panel”) and the right type of flow cytometer. When building flow assays, it helps to understand how flow cytometers read our mixtures of labels and produce the measurements that we spend so much time poring over during data analysis. In this post, we’re going to do a deeper dive into the technical side of how biomarker detection in flow works and the lessons it can teach us for practical assay design.

Somewhere Over the Rainbow – Biomarker Detection in Flow Cytometry

As we talked about in our very first blog post, flow cytometers operate on the principle that each label in a panel is attached to a fluorescent substance (also commonly referred to as a fluorochrome). These fluorochromes contain one or more fluorescent molecules (fluorophores), which can absorb light of a particular wavelength (color) from the cytometer’s lasers and emit light of another wavelength that can be captured by the cytometer’s detectors. The precise patterns of absorption and emission for each fluorochrome form its excitation and emission spectra: a distinct set of behaviors that form a recognizable signature in the measurements collected by our cytometer. The most important characteristics of this signature are the fluorochrome’s peak excitation and peak emission wavelengths: the points where it most strongly absorbs and emits light, respectively.    

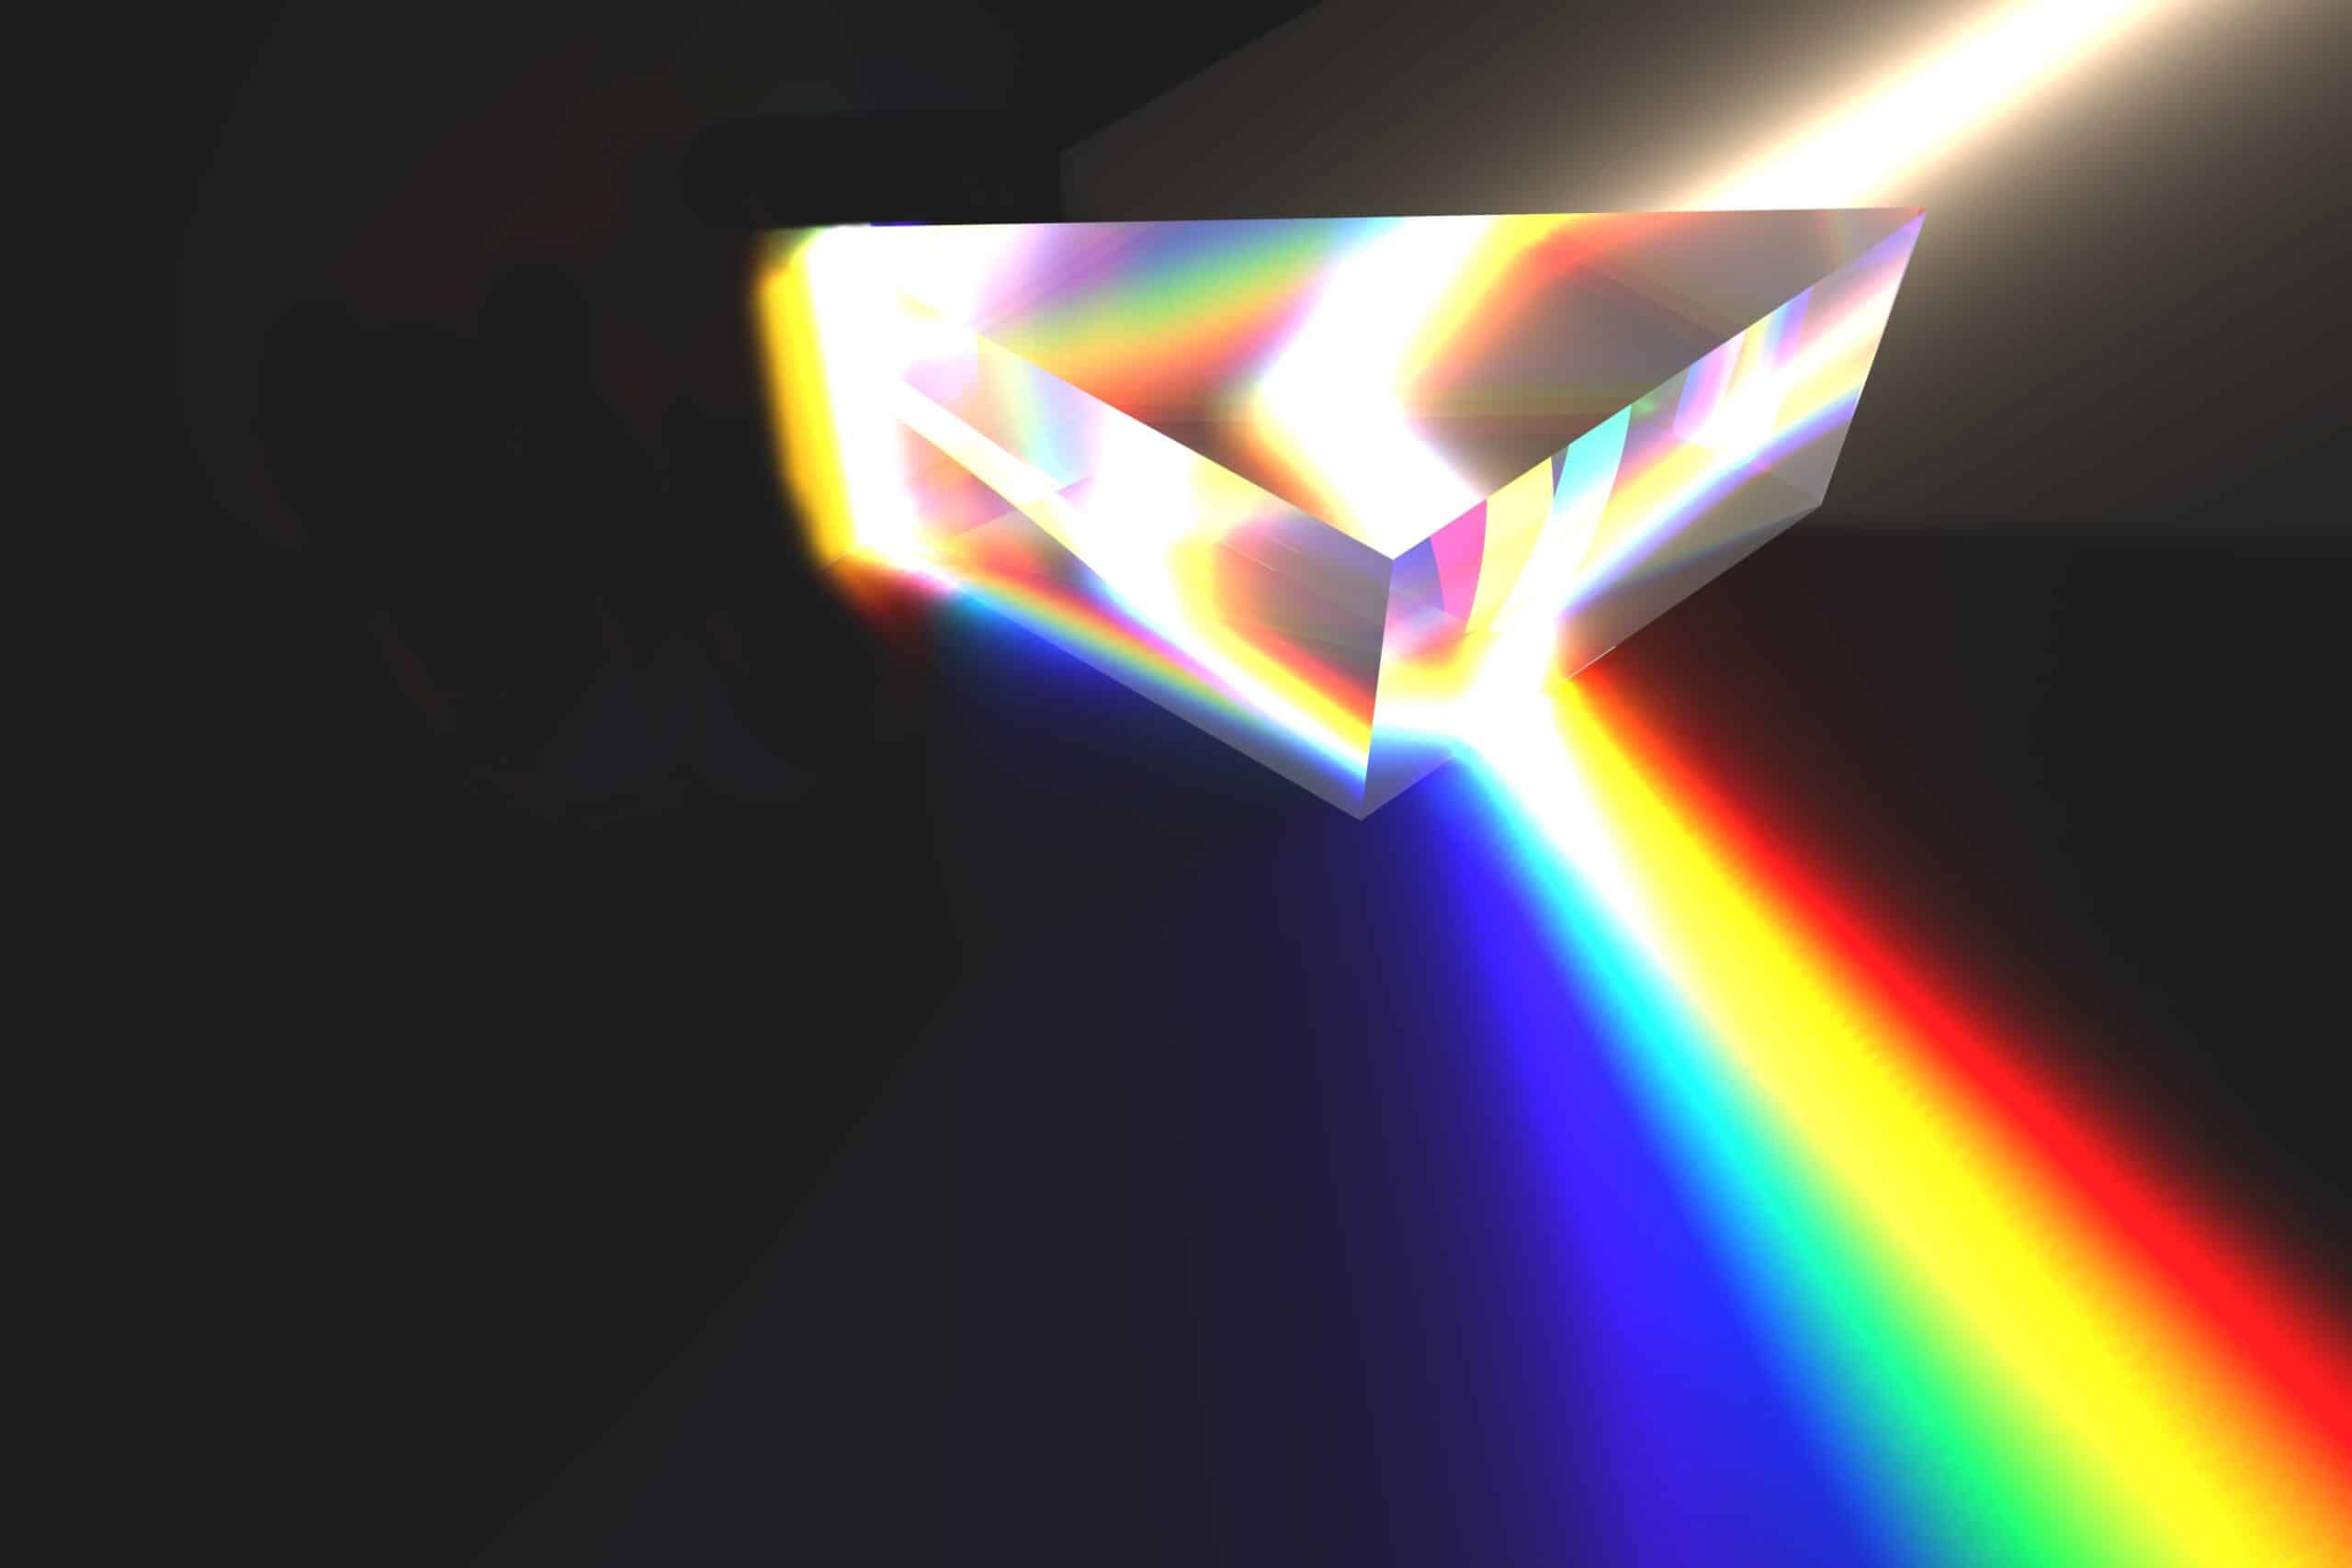
When picking reagents to use in a panel, it is important to use fluorochromes with as unique spectra as possible. By pairing markers to labels with distinct fluorescent signatures, we can more accurately trace the colors of light emitted by our sample back to their sources (our labels and biomarkers of interest). In a well-designed panel, a cytometer sees a cell like a human might see a rainbow: an array of carefully organized, unique colors that can be easily traced back to their origins. 

With that image in mind, you might ask: how large of a rainbow (how many colors) can a cytometer accurately “see”? The answer: it depends on how the flow cytometer is constructed! 

The first factor that influences a cytometer’s vision is how many lasers (different colors of excitation light) it is equipped with. The more lasers an instrument has, the more options you have to excite your fluorochromes with, and the better you can separate them based on that behavior.

As a simple example, let’s say we want to build a panel around two biomarkers: one marker for our cell type of interest (i.e CD3 for T cells) and one biomarker associated with the disease context we’re studying (i.e IL-17, an autoimmunity biomarker we discussed last time). We would expect both biomarkers to be found on the same cell at least some of the time, which means we need to pair them with highly distinct fluorochromes.  

Two commonly used fluorochromes that could fit this bill are PE and APC. PE (phycoerythrin) can absorb light from blue or yellow-green lasers (reaching peak excitation at 565 nm) and emits a light red light (reaching peak emission at 578 nm). Allophycocyanin (APC) also absorbs yellow-green laser light but can uniquely absorb red laser light (peak excitation: 640 nm) and emits a darker red light (peak emission: 650 nm). If our instrument is equipped with both a yellow-green and a red laser, these two fluorochromes will be very straightforward to distinguish from one another. When we shine each laser on our cells in turn, we can be very confident that any signal we measure is coming from only our PE label or our APC label.    

Using this same paradigm, we could expand our panel to include additional biomarkers using other distinctly excited fluorochromes, such as BV421 (best excited by violet laser light) and FITC (best excited by blue laser light). While there is some increased chance of misinterpretation for FITC, as PE also can be excited by blue light, we would expect the resolution of our two original biomarkers on PE and APC to be very similar between these 2 and 4 color panels. Success! We’re now collecting more information from our sample without any loss of accuracy – the dream scenario for any assay development scientist. 

What happens if we want to add even more biomarkers, though? What do we do once we run out of lasers on our instrument? 

Seeing Through Your Instrument’s Eyes: Conventional vs. Spectral Cytometers 


To go beyond very simple panels like the ones we just described, we have to utilize fluorochromes that have similar excitation but different emission spectra. Take PE and PE-Cy7 for example: both absorb yellow-green light equally well but have different peak emissions (lighter and darker red, respectively). While we can separately detect these in theory, to do so we must deal with the practical question of how to interpret the “in-between” shades of red that could originate from either fluorochrome (otherwise referred to as spectral overlap). The way a cytometer tries to solve this issue of overlap is the second factor that governs how many colors it can “see. 

A full review of all the intricacies of cytometer design is beyond the scope of a single blog post, so we will instead focus on the two main paradigms used in the field: “conventional” and “spectral” flow cytometers. If you want to know more about the history of these paradigms, as well as the underlying mathematics and their implications for flow data analysis, we recommend this excellent review article as a place to start. 

Conventional cytometers 

The standard instrumentation is still used in most clinical flow cytometry labs; these are built on the assumption that each fluorochrome in an assay will have a unique area of peak emission. Each detector in the instrument is set up with the intention of capturing light from one of these areas of peak emission. Individual fluorochromes and their labels are correspondingly assigned to the matching detector in the instrument (one label per detector). Overlap between the fluorochromes’ emission spectra is accounted for mathematically using a process called compensation. In brief, compensation corrects for overlap by assuming that some portion of the signal measured in each detector comes from all the other labels in the sample (determined by measuring singlelabeled control samples). This confounding signal is subtracted from the total, and the remainder is then assumed to be the “true” signal coming from the assigned label.

This conventional process, while in some ways crude, works very well for small palettes of highly distinguishable colors; think the primary colors of the rainbow, using our analogy from before. Most conventional instruments are equipped to accurately detect 10-12 fluorochromes very robustly, which is sufficient for many clinical assays. By incorporating more detectors and lasers, some systems can push this number even higher and separate 20-30 distinct fluorochromes accurately. Regardless of their hardware, however, all conventional instruments have very firm ceilings of detection. The more colors used, the harder it becomes to create and assign unique detectors for every color and the more signal that must be subtracted during compensation, reducing the effective resolution of each biomarker. 

Spectral cytometers

To address these limitations, spectral cytometers were developed to operate on a different principle: instead of assigning one detector to each fluorochrome, these instruments utilize a much larger array of detectors (more than the number of labels used) to measure the full visible light spectrum emitted from a sample as accurately as possible. This information is then used to deconvolute fluorochromes based on their whole spectral pattern, rather than solely based on their peak emissions. Mathematically, this process of spectral unmixing works similarly to compensation but takes advantage of the increased information gathered during acquisition in two main ways. First, spectral unmixing generally produces a more accurate estimate of the true signal for each label by virtue of simply gathering measurements from more detectors (larger sample size = lower error). This increased scope allows more highly overlapping labels that would be incompatible in a conventional assay to be distinguished and used together effectively in a panel.

The second advantage of spectral unmixing is that it allows these instruments to more effectively and accurately measure background noise coming from our cells (also known as autofluorescence). For T cells, this signature is easy to read and has little effect on our data; however, for larger, more complex cells, like neutrophils, it can present a significant hindrance in detecting certain fluorochromes (mainly ones excited by UV or violet light, which cells naturally absorb). Samples where these types of cells abound can benefit from using a spectral cytometer over a conventional instrument, as the unmixing can “extract” this background noise from the mixture of colors and increase the detection accuracy further for each label.

Summary of the main principles that underpin flow cytometry data collection and measurement 

A Colorful Conclusion 

Taken together, these technical principles have several important implications for flow cytometry as a technique:  

  1. Each additional biomarker you incorporate into a panel has a chance to reduce the resolution (accuracy of detection) for all your other biomarkers

As we illustrated, there reaches a point where using reagents with fully unique excitation spectra is no longer possible. That means that adding more markers and labels to a clinical assay always has potential consequences for data accuracy. The performance difference between a 6, 12, and 24 marker panel can be very substantial depending on the fluorochromes used and the nature of the biomarkers (see our third blog post for more discussion on this topic). Put more simply: more colors mean more potential problems (and more troubleshooting). Be deliberate when building your panel, and when in doubt, consult with an expert! 

  1. It pays to think about the whole spectrum, even if you’re using a conventional instrument

Conventional instruments might not be built to detect the entire visible light spectrum, but they still experience it. It’s easy to narrow your focus down to just the excitation and emission maxima when building panels and forget that fluorochromes paint in broad strokes, not points. Small, unanticipated spectral overlaps often create issues when it comes to compensation, so it’s worth identifying and minimizing them early. Sometimes fluorochromes’ behaviors can fluctuate due to unexpected reactions between your labels and your cells, so keep a careful eye out during your first experiments with a new panel! 

  1. Pick the right tools, not just the newest or most powerful ones

Be deliberate, not only in how many labels you pick but also which fluorochrome and instruments you utilize. While conventional cytometers are generally not as flashy or powerful as their spectral counterparts, they are reliable and robust to much of the variability inherent to clinical samples. Spectral cytometers, conversely, are thoroughbred racehorses: they are indisputably more powerful, but maintaining their performance can require a steadier hand. Similarly, newer dye classes can offer access to more colors and theoretically improve your panel, but sometimes it can make more sense to use a tried-and-true dye instead that you know works well.

Thanks for joining us on this deeper dive into the fundamentals of flow! Next time, we will dive back into a more application-focused topic with multiple myeloma and how flow can be used for minimum or measurable residual disease (MRD) detection. See you then!

References 

  1. Novo D. A comparison of spectral unmixing to conventional compensation for the calculation of fluorochrome abundances from flow cytometric data. Cytometry. 2022; 101(11): 885–891. https://doi.org/10.1002/cyto.a.24669 

About the Author

Christopher Rota

Chris is a Scientist on the Flow Cytometry team at HBRI, based in New Hyde Park, NY. Prior to joining HBRI in 2022, he obtained his PhD in Biological and Biomedical Sciences from Harvard University and a Bachelor’s degree in Biology from the University of North Carolina at Chapel Hill. His areas of expertise outside of flow cytometry include CAR T-cell therapeutic development, brain tumor biology, and disease model system development.